projects
BrierBench
Mar 2026
Can language models predict the future?
The most honest version of the question is the one ForecastBench asks. Every two weeks it samples 500 questions from Manifold, Polymarket, Metaculus, and INFER, hands them to about 25 models, and asks for a single number: the probability the event happens. One shot. No tools, no search, no chain of thought to grade. Then it waits for reality to resolve and scores the answer. The format is small and replicable, and the replicability is the interesting part.
The leaderboard’s primary metric is the Brier Index: a difficulty-adjusted score on a 0–100 scale where 100 is perfect and 50 is always saying 0.5. The superforecaster median sits at 70.8. The best LLM sits at 64.2. The trajectory of that LLM number has been climbing fast enough to make headlines.
Too good to be true
That climb is what got me curious. I have been burned by enough research papers to want a small-scale replication before I believe a headline. The leaderboard’s slope felt like the kind of thing that quietly turns out to depend on a freeze date or a question set that happened to be easy.
If it does replicate, the next question is the one I actually care about. How are frontier models getting these scores? Three plausible stories: they reason about base rates and evidence, they parrot the market price, or they cheat off training data that already covered the outcome.
So I rebuilt the benchmark from the outside.
Replicating the baseline
I ran the full replication on a cheap model on purpose. Replication failures (prompt mismatch, scoring bugs, eval-loop drift) do not get easier to spot by paying more per token; they show up in the aggregate regardless of model size. Ten dollars on Gemini-2.5-Flash buys you a row on the leaderboard, where the equivalent run on Sonnet-4-5 or Grok-4.20 would cost around $175. Frontier-model spot-checks come later, in the second experiment.
Gemini-2.5-Flash across all 24 historical question sets: 18,484 questions and 22,829 matched forecasts. Resolution data comes from the four prediction platforms via a mix of public APIs and scraping; the details are in the repo. The raw Brier scores (not the Index; that needs many models) come out close:
| Metric | Ours | Leaderboard | Delta |
|---|---|---|---|
| Dataset Brier | 0.185 | 0.170 | +0.015 |
| Market Brier | 0.132 | 0.146 | -0.014 |
| Overall Brier | 0.181 | 0.158 | +0.023 |
Cohen’s d = 0.12 across ~23k forecast rows: small. The aggregate matches, but the per-category deltas do not cancel; dataset and overall run high, market runs low. Something subtle differs between the two pipelines, but the headline still holds.
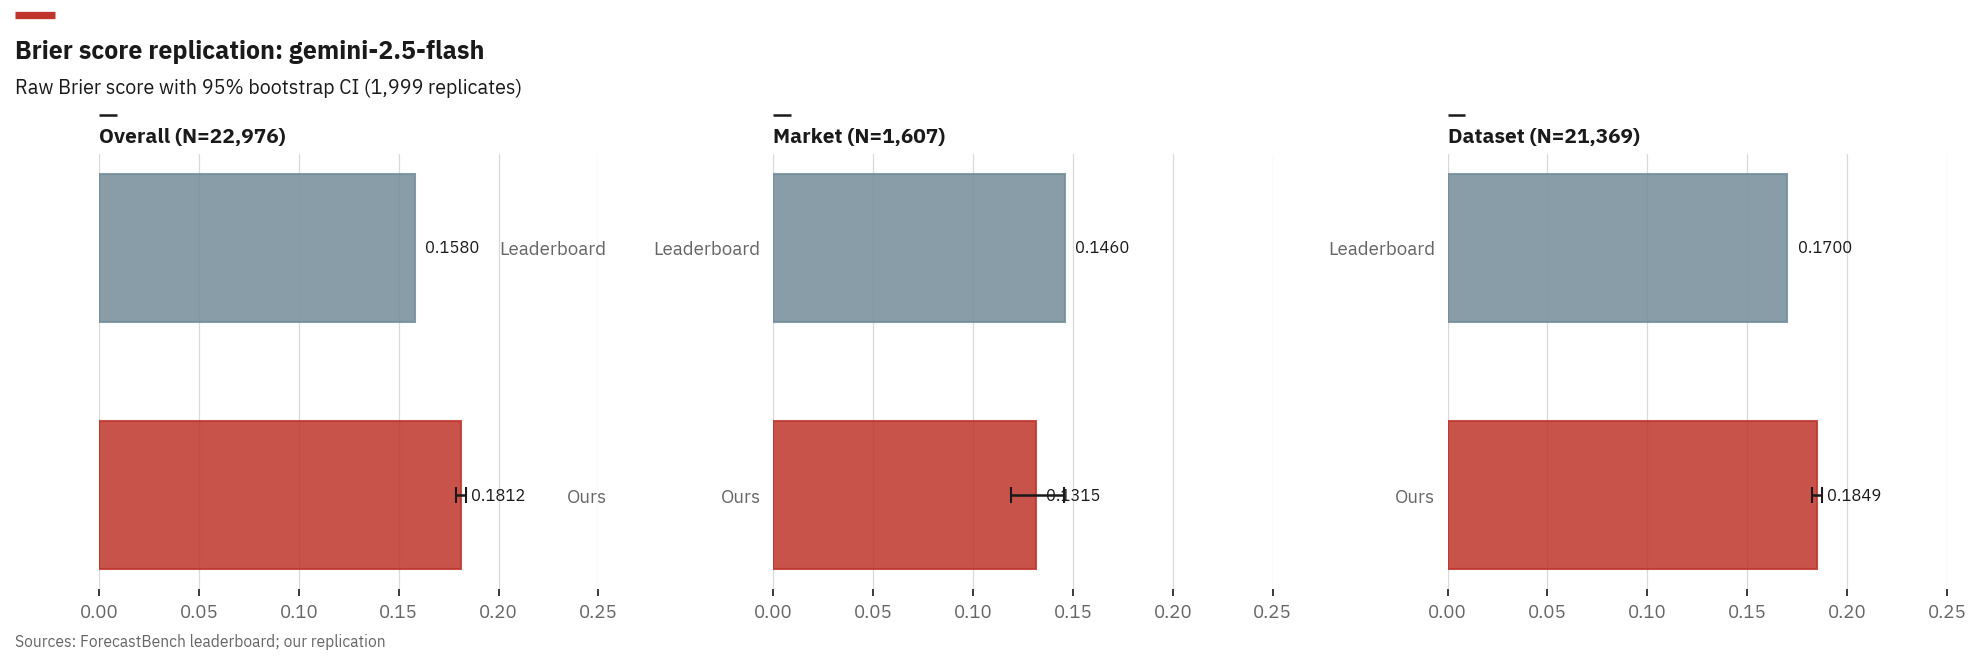
Raw Brier score comparison for Gemini-2.5-Flash: our replication vs ForecastBench leaderboard, with 95% bootstrap confidence intervals.
One caveat. I forecast retroactively, calling the model in March 2026 on questions from 2024 to 2026, so it could have indirect knowledge of some outcomes. That the scores still match is consistent with retroactive knowledge being a small effect; it does not prove the effect is small, only that aggregate accuracy survives it.
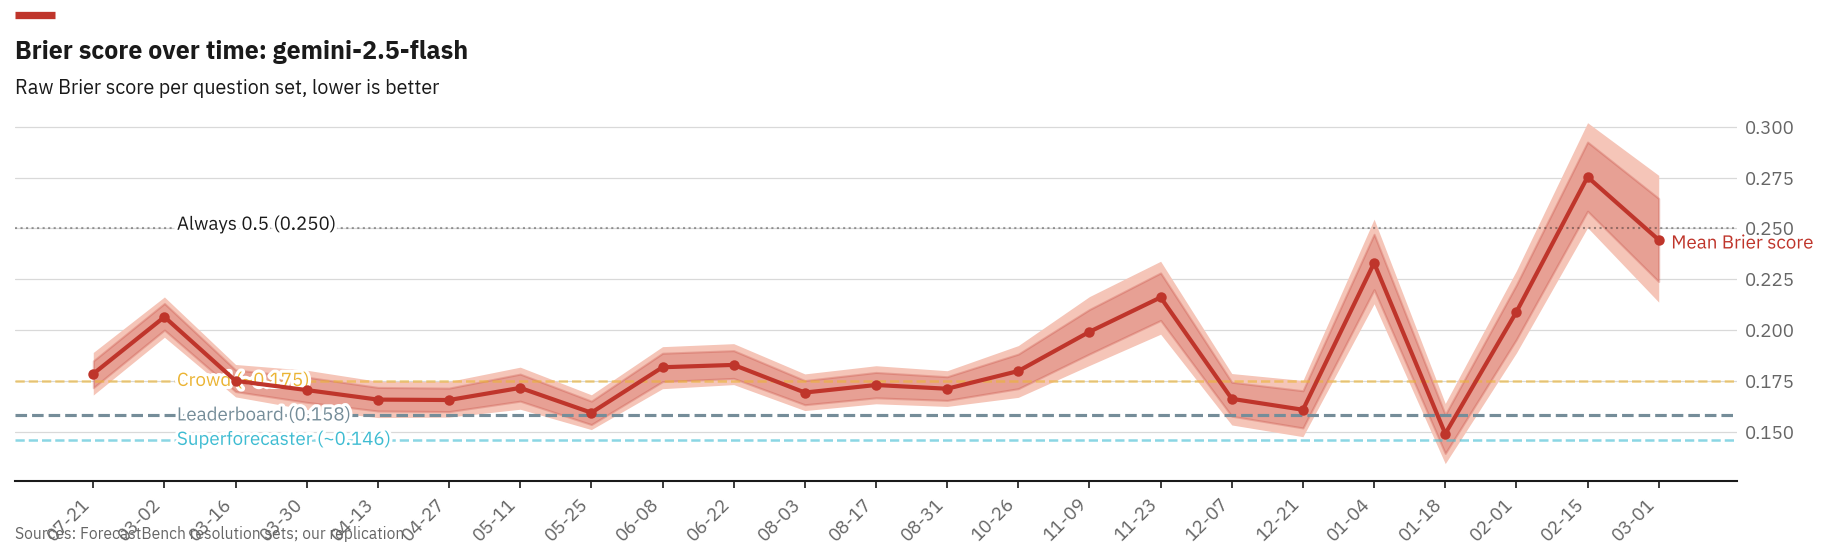
Per-question-set Brier scores show real temporal variation. Recent sets trend higher as fewer questions have resolved, biasing toward longer-horizon forecasts.
How are they getting good scores?
The more revealing experiment was benchmarking three frontier models against live market prices from all four platforms (247/250 questions, 98.8% coverage). Each of the three stories (reason, crowd-follow, cheat) leaves a different fingerprint, but a one-shot probability against a live market only really separates one of them. A model that hugs the market price is consistent with crowd-following. A model that wanders away from the crowd is not. Reasoning and contamination both produce some disagreement with markets; this experiment cannot tell them apart on its own.
| Model | Mean |delta| | Median |delta| | Bias | Higher/Lower |
|---|---|---|---|---|
| GPT-5.4 | 0.220 | 0.154 | -0.036 | 100/113 |
| Gemini-3.1-Pro | 0.224 | 0.140 | -0.083 | 72/142 |
| Grok-4.20-beta | 0.274 | 0.200 | +0.061 | 118/97 |
Each model has a personality.
GPT-5.4 is a consensus tracker. Its forecasts cluster near market prices, with the smallest median deviation. It rarely strays far from the crowd.
Gemini-3.1-Pro is conservative. It systematically predicts lower probabilities than the market; a negative bias of -0.083 means it is consistently more sceptical.
Then there is Grok-4.20-beta, the contrarian: the highest mean deviation and a positive bias. Its forecasts also cluster at extreme round numbers like 92% and 95%; the model is happy to disagree with the crowd at full volume.
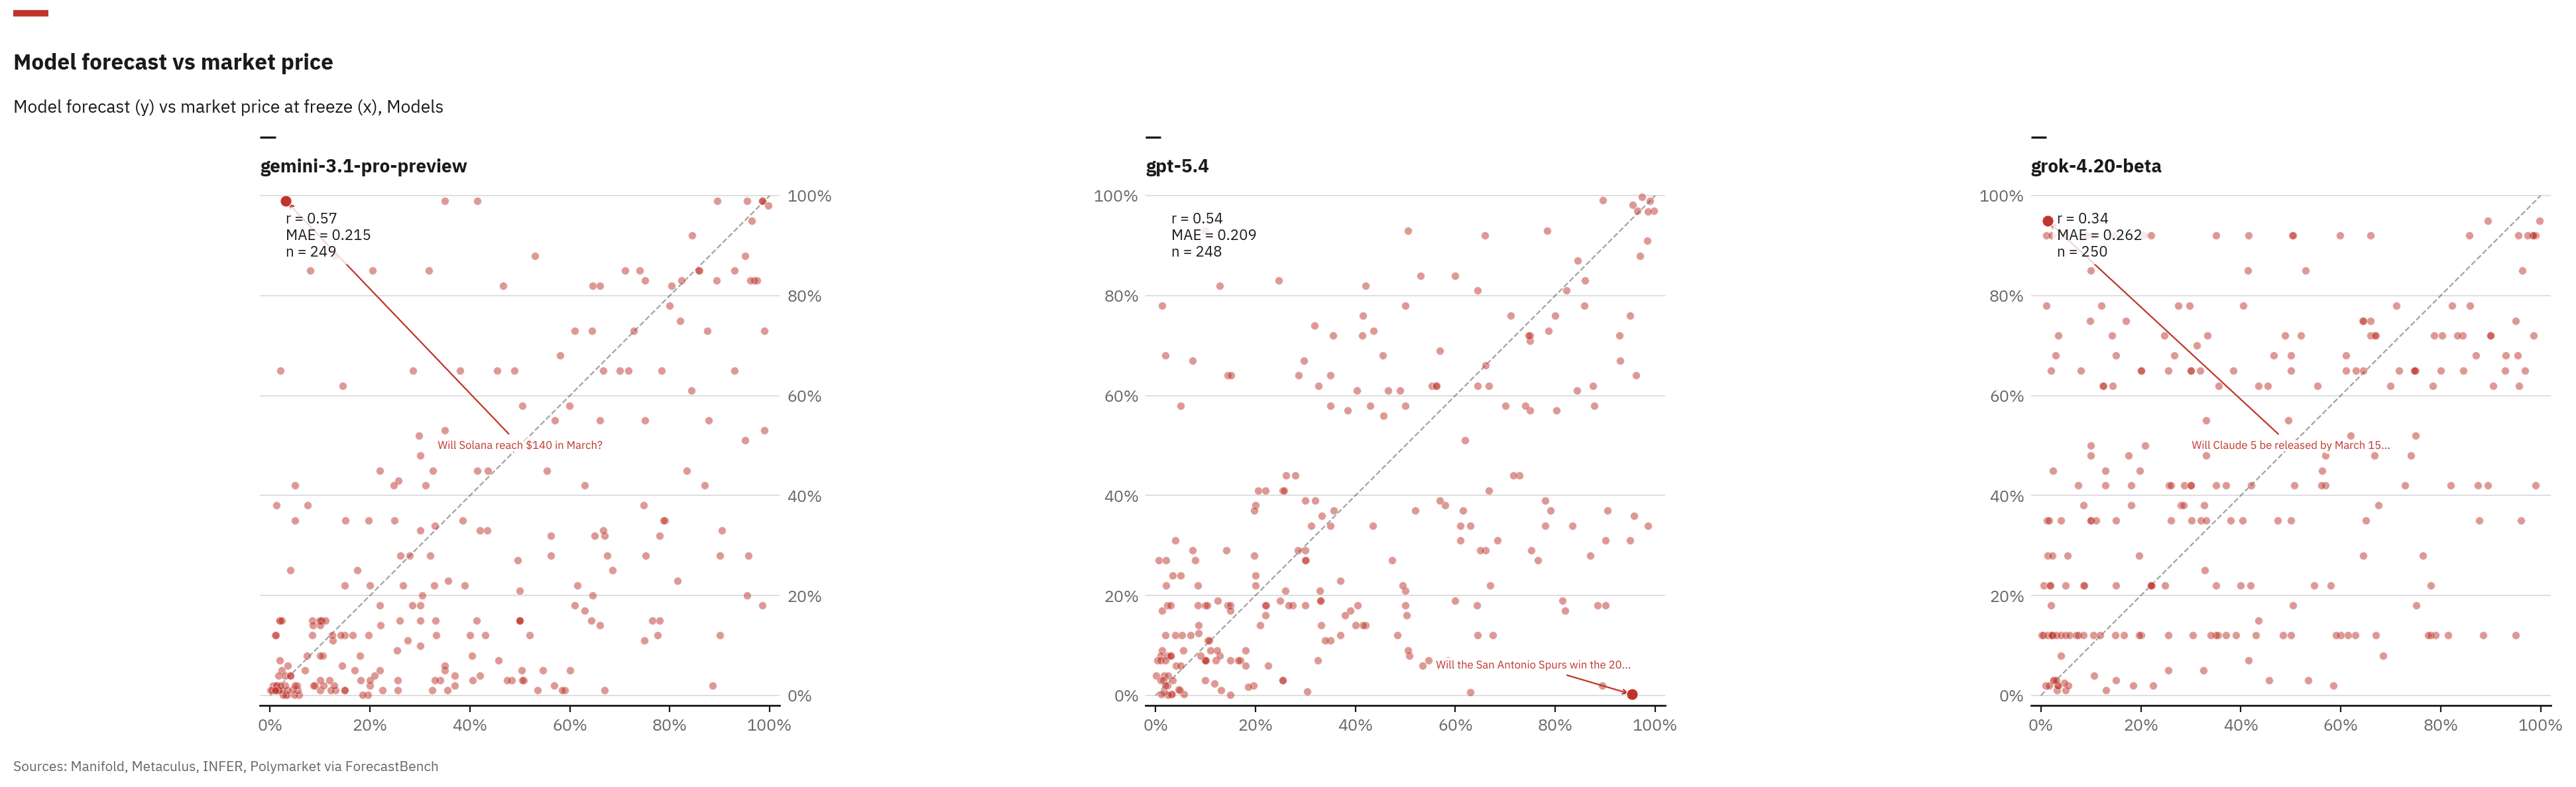
Model forecast vs live market price for three frontier models. The diagonal represents perfect agreement with the crowd.
These questions are live; outcomes haven’t resolved yet, so I can’t grade Brier on this set directly. The leaderboard’s resolved questions are the next-best proxy: there the superforecaster median scores a Brier Index of 70.8 against the best LLM’s 64.2. The crowd is well calibrated, the LLMs are not yet. Extrapolating from that leaderboard to here, contrarianism against a well-calibrated crowd is the kind of bet that loses money on average. The cleanest reading is that LLM “forecasting skill” looks a lot like good crowd-tracking dressed up as judgement, though I want resolved outcomes on this batch before staking too much on it.
Agentic + pastcasting
The one-shot setup is a clean benchmark, but it is also a strange one; no real forecaster works that way. So I built a second environment on top of the same questions. The setup is pastcasting: pretend today is some fixed date in the past and forecast forward from there. The model is given the question, told the simulated date, and handed three tools (web search, time-advance, probability-update) to use as it sees fit. Scoring is a time-weighted Brier where later predictions count more, rewarding refinement.
The hard part is leakage. To run a model on a 2024 question as if it were 2024, the web search has to pretend nothing after that date exists. Exa offers an end_published_date filter, which sounds like the whole story until you look at the pages it returns. Publication metadata is wrong all the time: pages get backdated, articles get silently updated, dates go missing. The “historic” filter is a polite suggestion.
The mitigation is a second pass. Every search result goes through a cheap Haiku 4.5 call that reads the page and drops it if it references events after the simulated date. It catches the obvious cases: a “2024 election” article that mentions the 2025 inauguration, a market analysis silently updated last week. It does not catch everything. The honest version of strict evaluation requires picking models whose training cutoff falls before the question’s start date, and even then you are trusting the model’s self-reported cutoff.
The cost shape is different too. A typical rollout fires off twenty to thirty tool calls and runs ten to fifteen minutes wall-clock; at Grok-4.20’s $2/$6 per million tokens, per-question cost lands one to two orders of magnitude above the one-shot run.
The early result is the interesting bit. Running Gemini-3-Flash on a ten-question pilot of the train split, three strategies:
| Strategy | Mean Brier (n=10) |
|---|---|
| Zero-shot (one number) | 0.056 |
| Forecast-skill agent | 0.104 |
| Zero-shot + web research | 0.140 |
Adding tools made the model worse. The obvious intuition says the opposite: give it search and a chance to think and it should do better. At n=10 this could easily be small-sample noise. The honest reading is that more compute is doing something other than helping, and the next move is to scale up enough to tell noise from signal.
The agentic environment is published as an OpenReward task: 6,671 training tasks and 1,667 test tasks split by date.
Bottom line
The headline replicates. Frontier models really do score in the ballpark the leaderboard claims, and the pipeline to check this independently fits in a weekend. The more interesting finding is underneath. Of three frontier models on the live-market batch, one hugs the crowd and one wanders into the corners; the leaderboard’s resolved data says the wanderer pays for it on average. In the agentic setup, giving a model more rope made it forecast worse, at least at n=10. Whatever “forecasting ability” we are measuring, a large part of it seems to be the ability to read a prediction market and write down a number near it.
References
- Karger, E., et al. (2025). “ForecastBench: A Dynamic Benchmark of AI Forecasting Capabilities.”
- Halawi, D., et al. (2024). “Approaching Human-Level Forecasting with Language Models.” arXiv:2402.18563.